Info Box 1
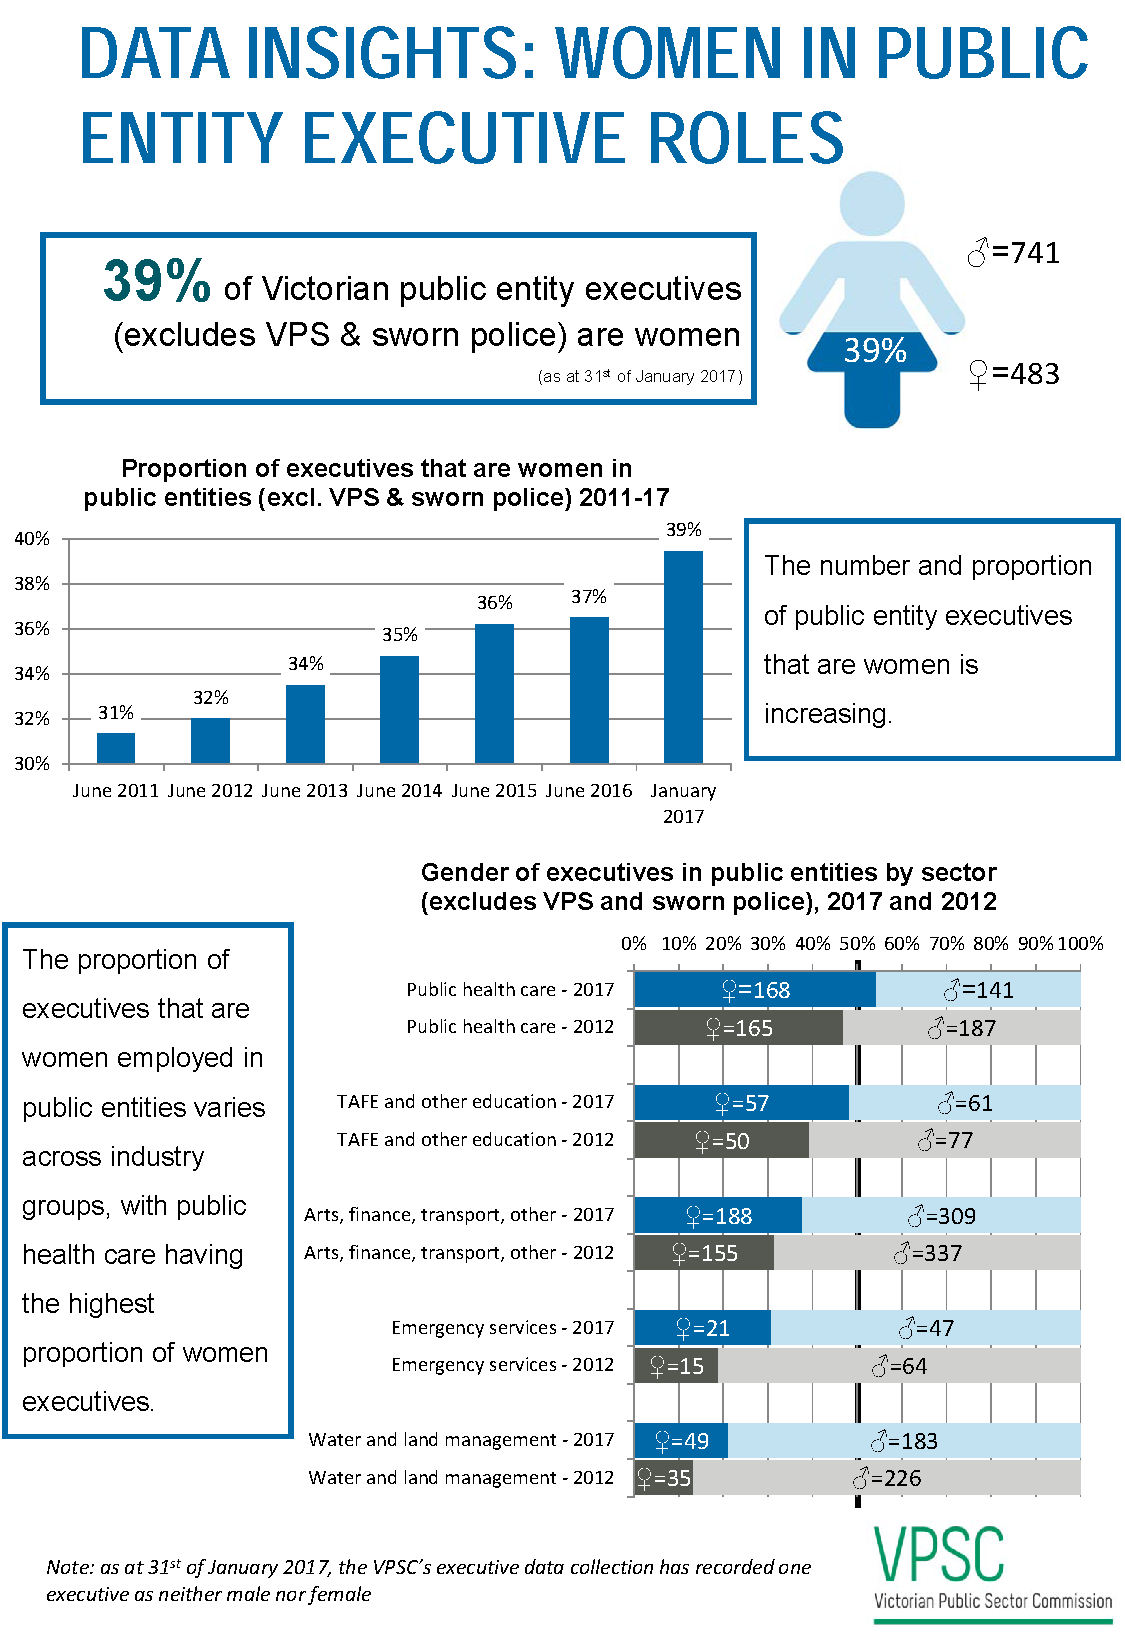
“39 per cent of Victorian public entity executives (excludes VPS and sworn police) are women (as at 31 January 2017)”
Blue infographic in the shape of a female logo filled in dark blue almost halfway from the bottom with the number 39 per cent inside it denoting the proportion of executives who are women. It also notes that the number of men executives in public entities (excluding VPS & sworn police) is 741 while the number of women executives is 483.
Info Box 2
“The number and proportion of public entity executives that are women is increasing.”
A column chart titled “Proportion of executives that are women in public entities (excluding VPS & sworn police) 2011 to 2017” that demonstrates a steady, year-on-year increase in the proportion of women in these executive roles.
June 2011: 31 per cent
June 2012: 32 per cent
June 2013: 34 per cent
June 2014: 35 per cent
June 2015: 36 per cent
June 2016: 37 per cent
January 2017: 39 per cent
Info Box 3
“The proportion of executives that are women employed in public entities varies across industry groups, with public health care having the highest proportion of women executives.”
100 per cent stacked bar graph titled “Gender of executives in public entities by sector (excludes VPS and sworn police), 2017 and 2012” that provides both the percentage and absolute number of men and women executives in the public sector across five public entity industry groups in January 2017 (in blue) and June 2012 (in grey). It is arranged from top to bottom from the highest proportion of executives that are women to the lowest, with the same pattern of decreasing order applying to the five industry groups in both 2012 and 2017. For each industry group, between 2012 and 2017, there was an increase in the percentage of executives that are women.
Public health care – 2017: 168 women (54 per cent), 141 men (46 per cent)
Public health care – 2012: 165 women (47 per cent), 187 men (53 per cent)
TAFE and other education – 2017: 57 women (48 per cent), 61 men (52 per cent)
TAFE and other education – 2012: 50 women (39 per cent), 77 men (61 per cent)
Arts, finance, transport, other – 2017: 188 women (38 per cent), 309 men (62 per cent)
Arts, finance, transport, other – 2012: 155 women (32 per cent), 337 men (68 per cent)
Emergency services – 2017: 21 women (31 per cent), 47 men (69 per cent)
Emergency services – 2012: 15 women (19 per cent), 64 men (81 per cent)
Water and land management – 2017: 49 women (21 per cent), 183 men (79 per cent)
Water and land management – 2012: 35 women (13 per cent), 226 men (87 per cent)