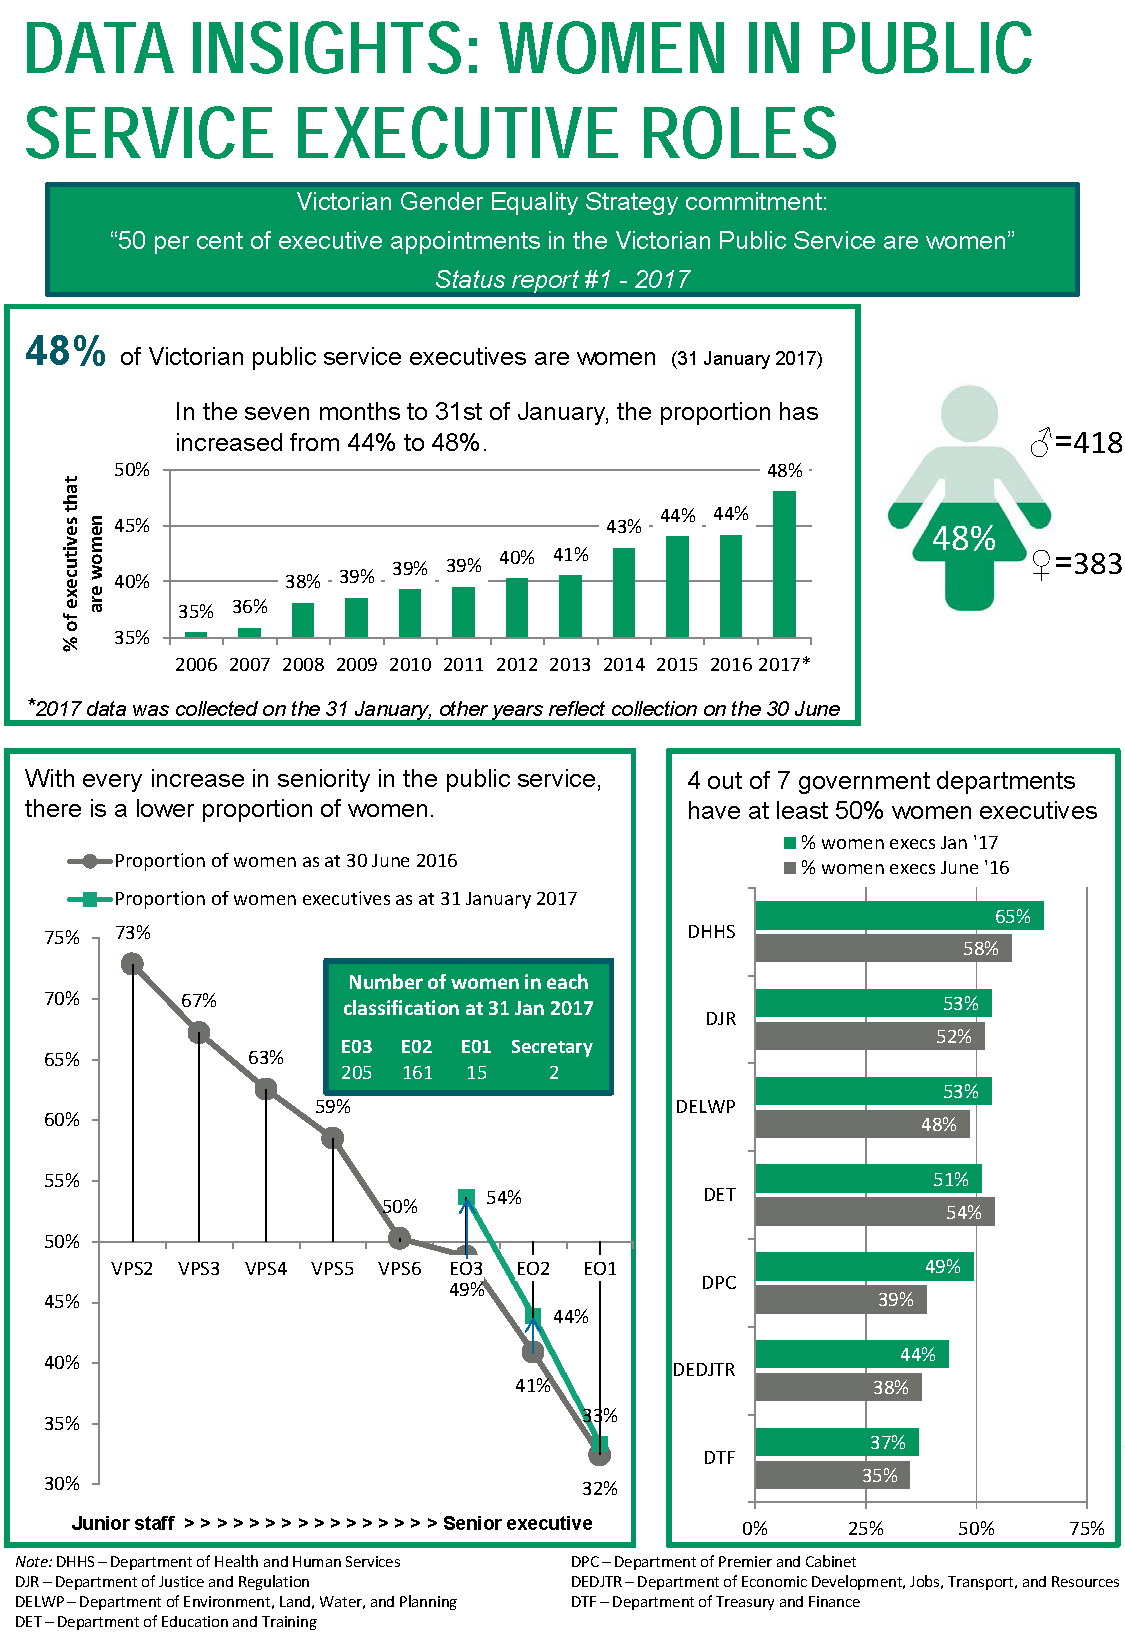
DATA INSIGHTS: WOMEN IN PUBLIC SERVICE EXECUTIVE ROLES
Victorian Gender Equality Strategy commitment:
“50 per cent of executive appointments in the Victorian Public Service are women”
Status report #1 – 2017
Info box 1
“48 per cent of Victorian public service executives are women (as at 31 January 2017)”
“In the seven months to 31st of January, the proportion has increased from 44 per cent to 48 per cent.”
Column chart demonstrating the increase in the proportion of public executives that are women, from 2006 to 2017. Every year the proportion increases, although some years it increases by less than 1 percentage point.
2006: 35 per cent
2007: 36 per cent
2008: 38 per cent
2009: 39 per cent
2010: 39 per cent
2011: 39 per cent
2012: 40 per cent
2013: 41 per cent
2014: 43 per cent
2015: 44 per cent
2016: 44 per cent
2017*: 48 per cent
* 2017 data was collected on 31 January, other years reflect collection on the 30 June.
Pictograph
Green pictograph in the shape of a female logo filled in dark green almost halfway from the bottom with the number 48 per cent inside it, denoting the proportion of executives who are women. It also notes that the number of men executives in the public service is 418 while the number of women executives is 383.
Info box 2
“With every increase in seniority in the public service, there is a lower proportion of women.”
Line chart with a table inset demonstrating how as the classification of public service employees increases in seniority from VPS2 to VPS6 and from E03 to E01, the proportion of women in these roles decreases. It also demonstrates that the proportion of women executives in each executive classification has increased since 30 June 2016.
The first line, in grey, represents the proportion of women in each classification as at 30 June 2016.
VPS2: 72 per cent
VPS3: 67 per cent
VPS4: 63 per cent
VPS5: 59 per cent
VPS6: 50 per cent
E03: 49 per cent
E02: 41 per cent
E01: 32 per cent
The second line, in green, shows the proportion of executives that are women as at 31 January 2017.
E03: 54 per cent
E02: 44 per cent
E01: 33 per cent
The inset table shows the number of women in each executive classification at 31 January 2017.
E03: 205 women
E02: 161 women
E01: 15 women
Secretary: 2 women
Info box 3
“4 out of 7 government departments have at least 50% women executives”
Bar chart showing the proportion of executives that are women in each of the seven Victorian government departments, with green bars showing the proportions in January 2017, and grey bars showing the proportions in June 2016. The departments are arranged top to bottom from the highest proportion of executives that are women in January 2017, to the lowest proportion of executives that are women in January 2017.
DHHS – Department of Health and Human Services
January 2017: 65 per cent
June 2016: 58 per cent
DJR – Department of Justice and Regulation
January 2017: 53 per cent
June 2016: 52 per cent
DELWP – Department of Environment, Land, Water, and Planning
January 2017: 53 per cent
June 2016: 48 per cent
DET – Department of Education and Training
January 2017: 51 per cent
June 2016: 54 per cent
DPC – Department of Premier and Cabinet
January 2017: 49 per cent
June 2016: 39 per cent
DEDJTR – Department of Economic Development, Jobs, Transport, and Resources
January 2017: 44 per cent
June 2016: 38 per cent
DTF – Department of Treasury and Finance
January 2017: 37 per cent
June 2016: 35 per cent