How to read this page
Unless stated otherwise, this workforce data shows you numbers as at June 2020.
For most visuals, we give you a break down in 3 ways:
- Victorian Public Service (VPS): the 8 departments and 43 authorities and offices defined to be public service employers under the Public Administration Act 2004
- Public entities: all other public sector bodies outside the VPS that have a public function
- Overall public sector workforce: public entities and VPS combined
At the end of this page, find Excel datasets for June 2015 to June 2020.
Read more about how we define the public sector or see the full list of public sector agencies.
I want to find out about:
- Key facts
- Number of employees by industry as a %, regional Victoria
- Number of employees by industry as a %, Greater Melbourne Metro area
Get the data set on:
Key facts
Work locations
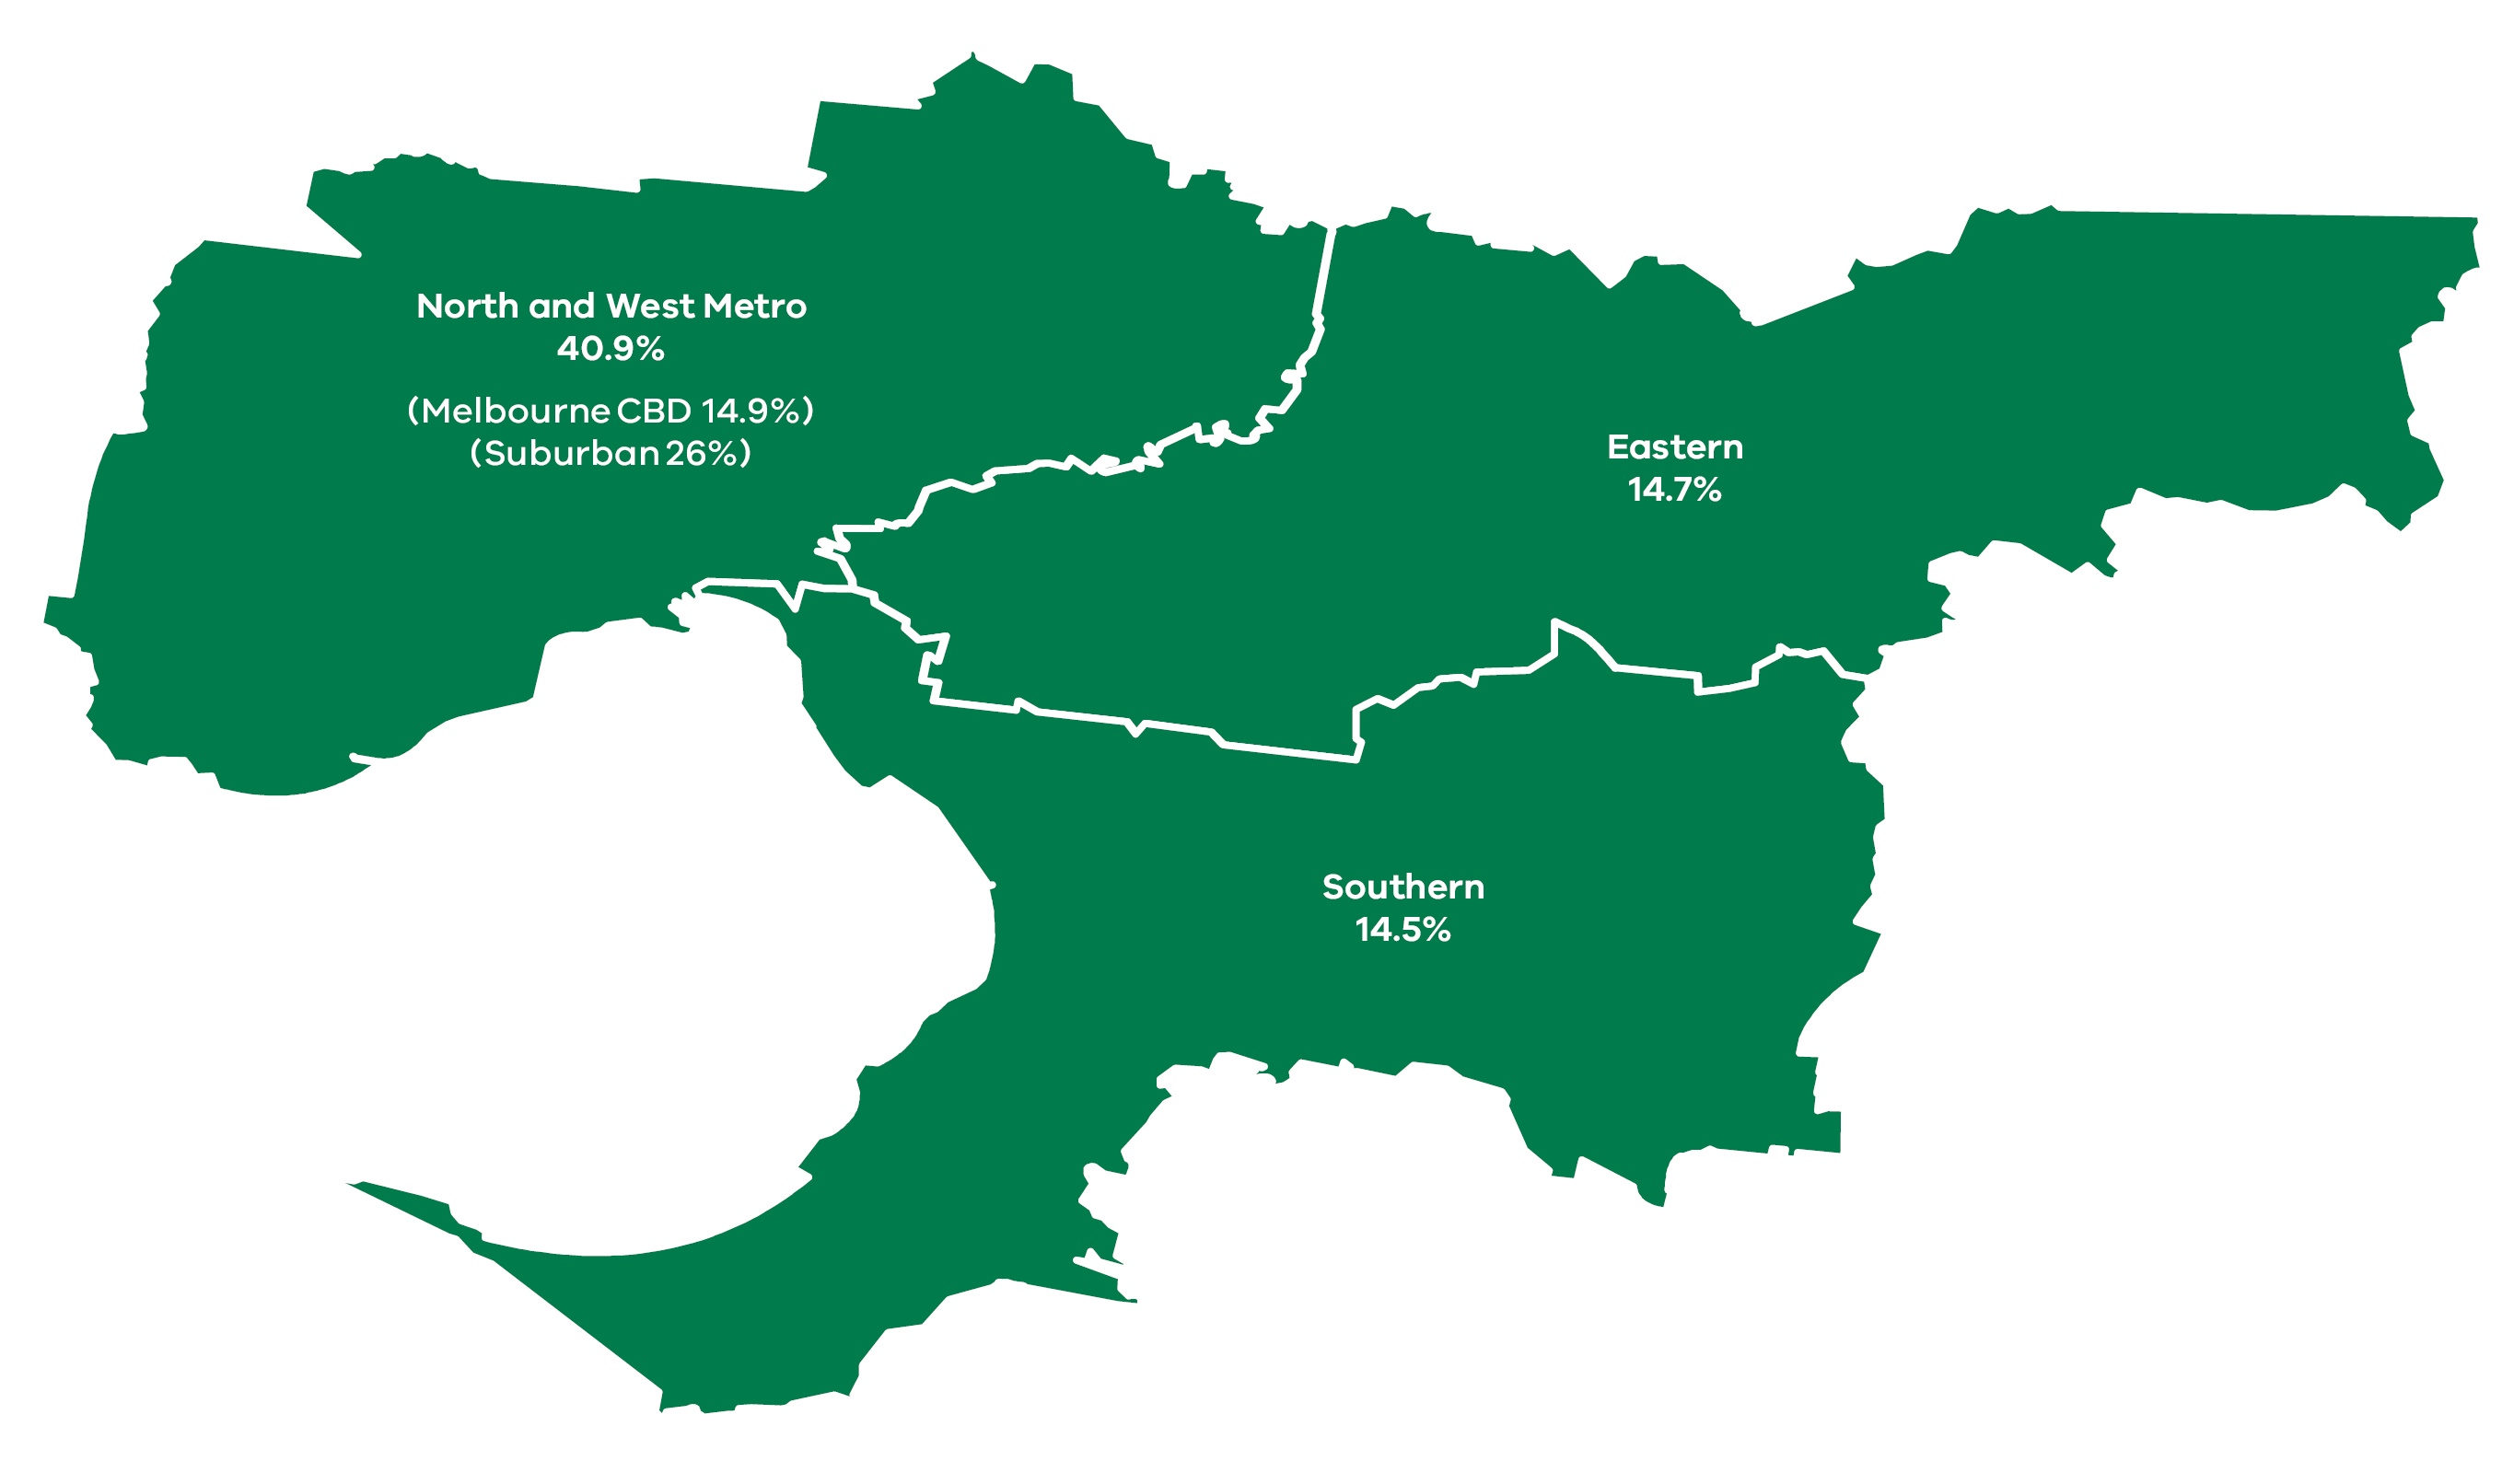
- 70% of the public sector workforce works in the Greater Melbourne Metro area
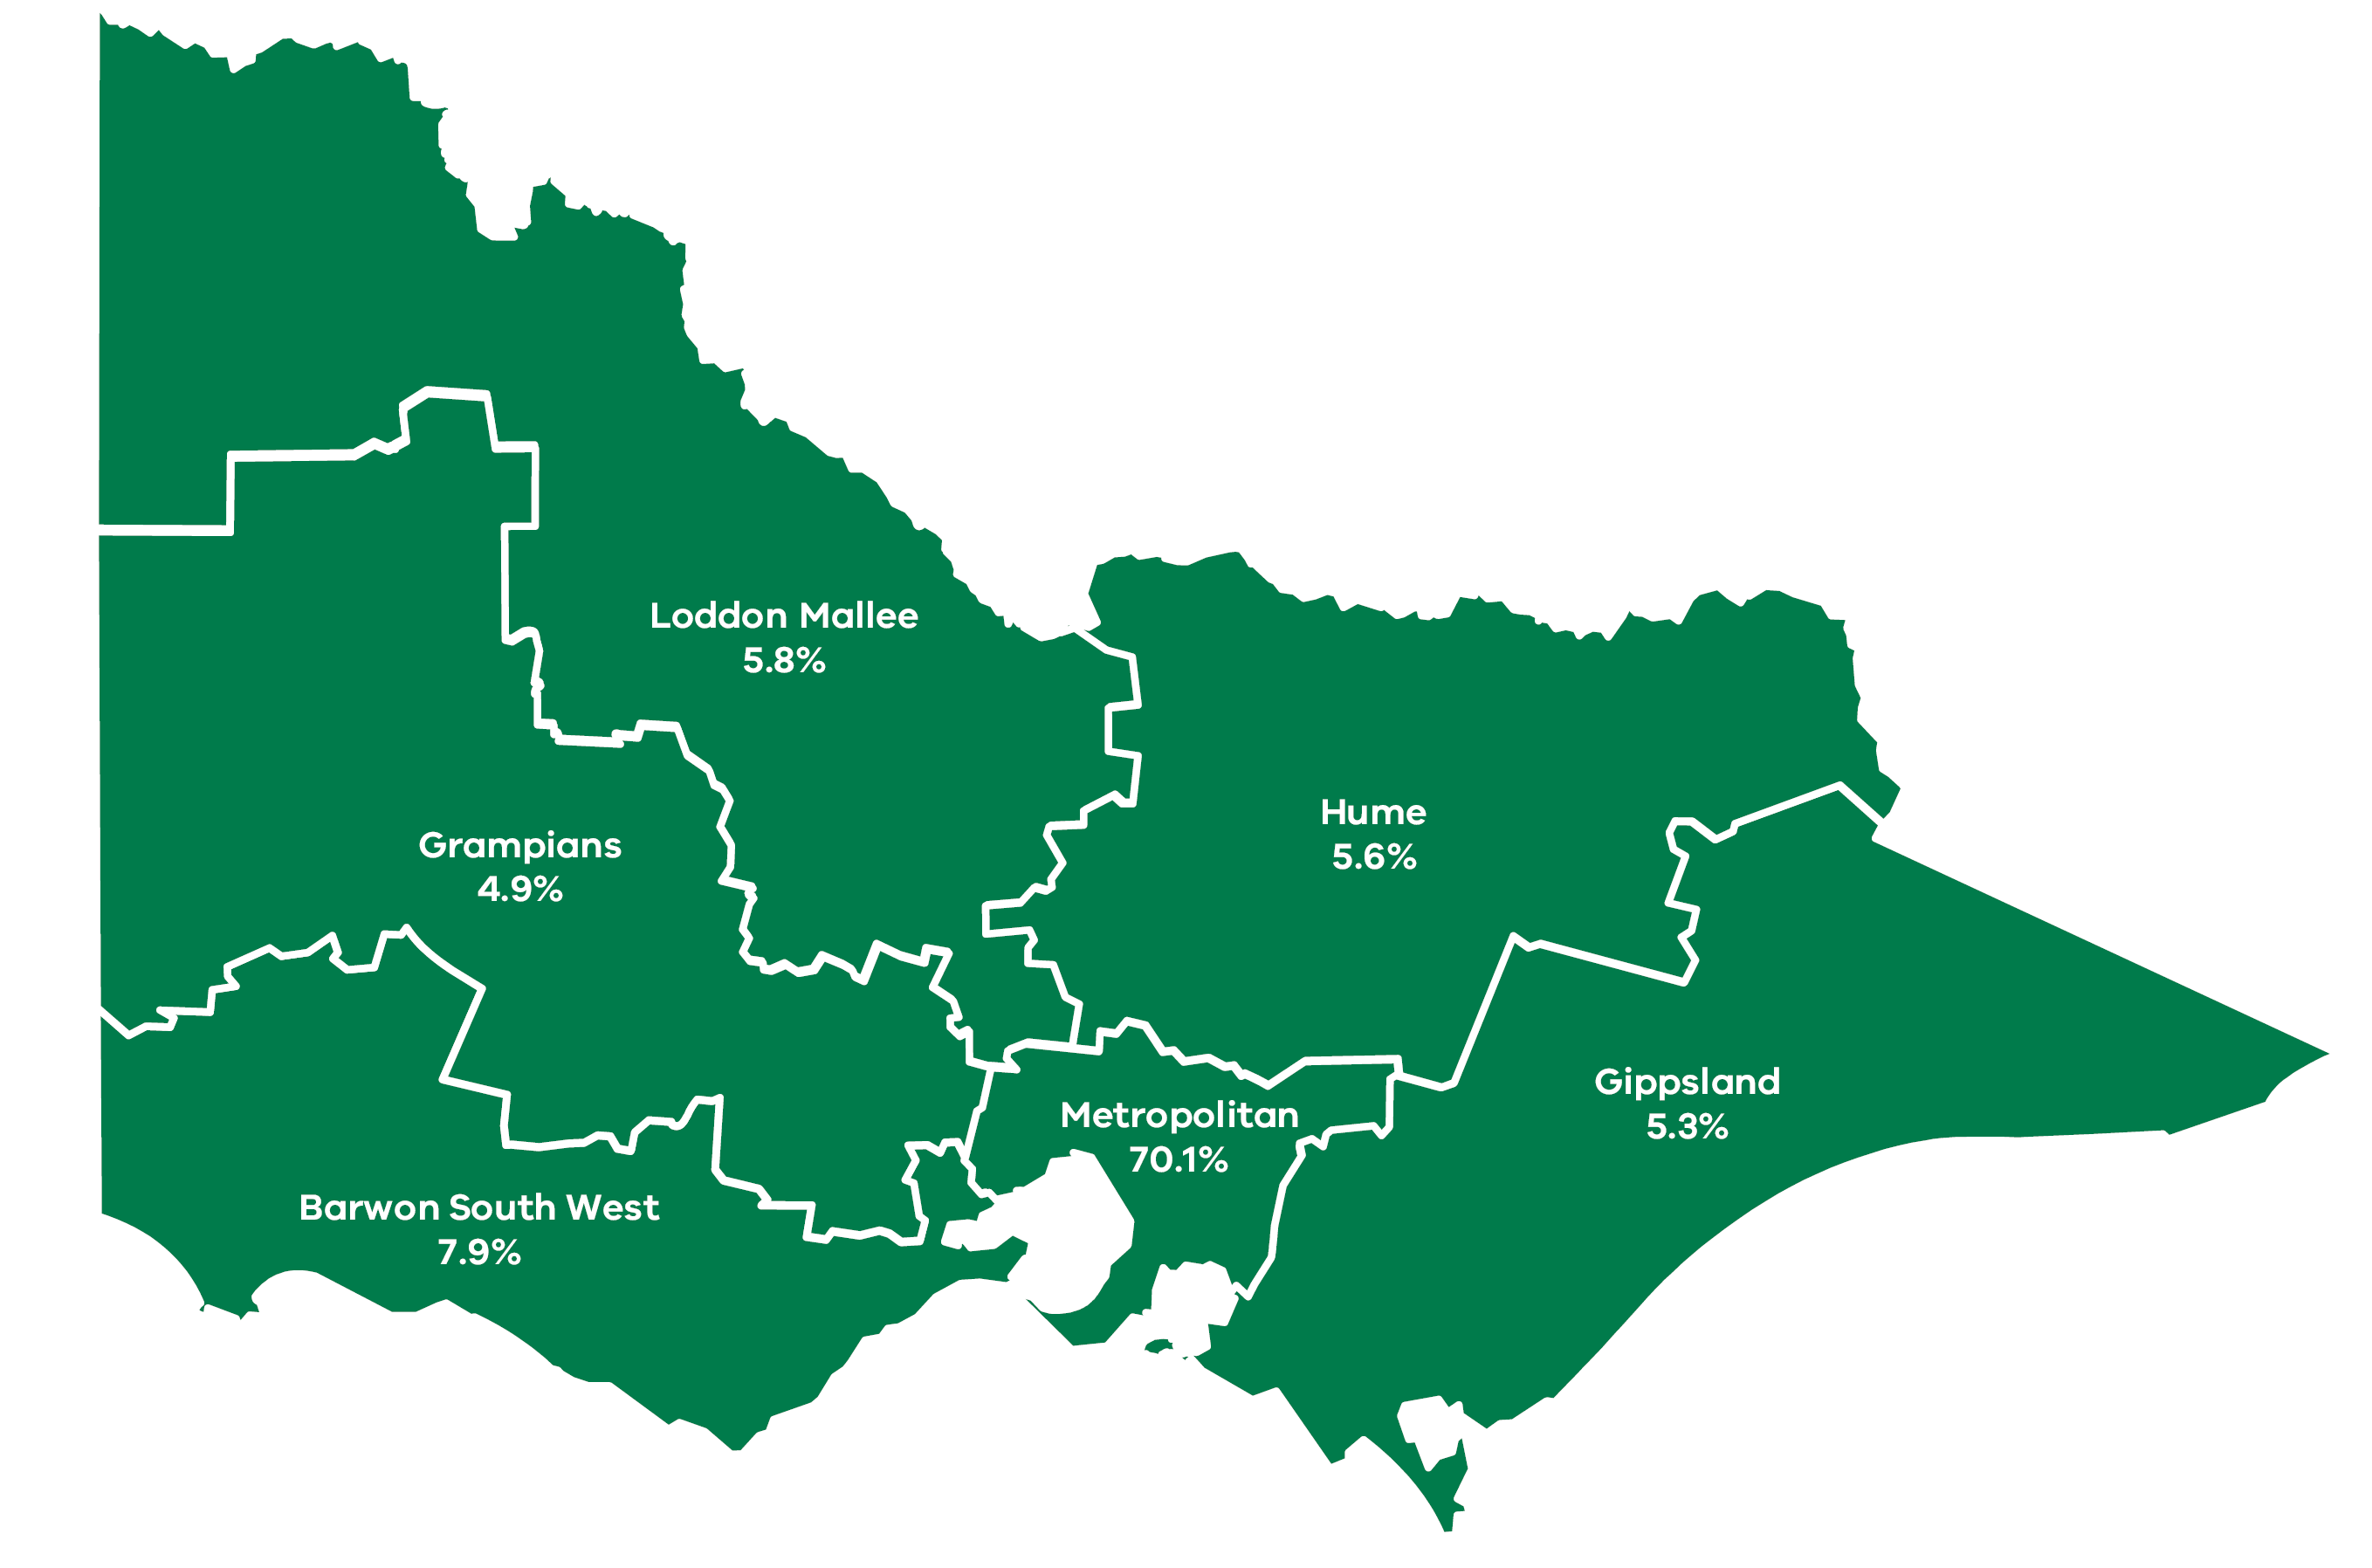
- 30% of the public sector workforce works in Regional Victoria
As at June 2020, if COVID-19 directions hadn’t required employees to work at home:
- 14.9% or 48,145 of all public sector employees would have had their normal work location in Melbourne’s CBD
Percentage of the total Victorian labour market
At June 2020, the public sector comprised:
- 8% of Greater Metropolitan Melbourne’s labour force
- 13% of Regional Victoria’s labour force
Regional Victoria work location
Greater Melbourne Metro area
Percentage of industry group’s employees located in each region
Data sets
For the most up to date data on employee work location, see our most recent release: 2021 employee work locations