This first part focuses on perceptions of employees born overseas and Aboriginal and Torres Strait Islander people*.
Forthcoming parts will discuss people with a disability, female and male employees, lesbian, gay, bisexual, transgender and intersex (LGBTI) employees.

|
This is the first edition of the VPSC’s Data Insights series. Each Insight piece in this series will present findings from the VPSC’s workforce data holdings, combined with wider research, to highlight key workforce issues in the Victorian public sector and indicate where action is required. Matters to be covered in the coming months as part of the series will include workplace diversity, bullying, employee engagement and wellbeing, sexual harassment, learning and development, and career intentions. |
Why diversity and inclusion matters
Diverse and inclusive workforces that reflect the communities they serve derive multiple benefits. They are:
- more capable of understanding and meeting the needs of customers
- adept at providing different ways of looking at work issues, driving innovation and boosting productivity
- better placed to attract and retain talent[1].
Inclusiveness in the public sector
Victorian public sector workplaces are supportive of diversity and inclusion, according to the 2016 People Matter Survey.
Over 51,000 employees from 123 public sector organisations completed a new diversity and inclusion module of the VPSC People Matter Survey in 2016. When asked whether their organisation had a positive culture in relation to diverse groups:
- 81 percent report a positive workplace culture for employees from varied cultural backgrounds
- 69 percent of all Aboriginal respondents report a positive workplace culture for Aboriginal employees.
Employees born overseas
More than one in five survey respondents indicated they were born overseas.
Employees born overseas are equally positive as Australian born employees about workplace inclusiveness for people from varied cultural backgrounds.
Place of birth does not impact on perceptions of the extent to which cultural background determines success within the organisation (figure 1). Similarly, it does not impact perceptions of the extent to which workplace cultures are positive for employees from varied cultural backgrounds (figure 2).

View text version of Figure 1 bar chart

View text version of Figure 2 bar chart
Employees born overseas in countries where English is not a main language are more likely than other employees to perceive their organisation as inclusive and fostering an environment where people are treated fairly and with respect (figure 3 and figure 4).

View text version of Figure 3 bar chart
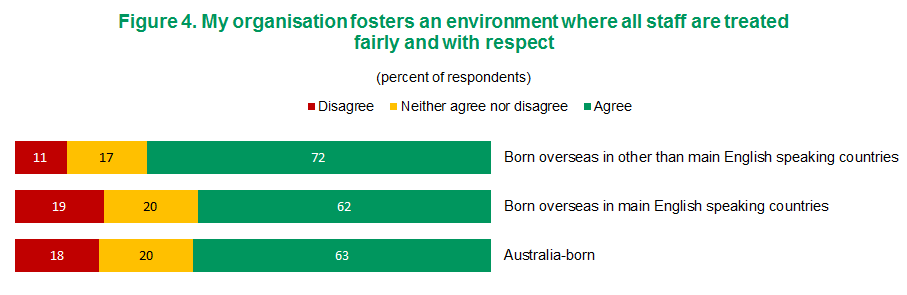
View text version of Figure 4 bar chart
Aboriginal employee perceptions
The profile of survey respondents shows that 0.9 percent identify themselves as Aboriginal and/or Torres Strait Islanders.
The majority of Aboriginal employees (69 percent) report a positive workplace culture for people who are Aboriginal. This was even higher than the positive rating result of all respondents (at 64 percent). However, 13 percent of Aboriginal employees, reported a negative workplace culture (see figure 5).
Aboriginal employees are more likely than non-Aboriginal employees to perceive cultural background as a barrier to success in their workplace (see figure 6).
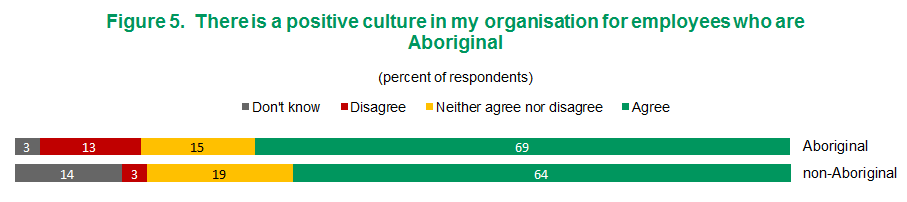
View text version of Figure 5 bar chart
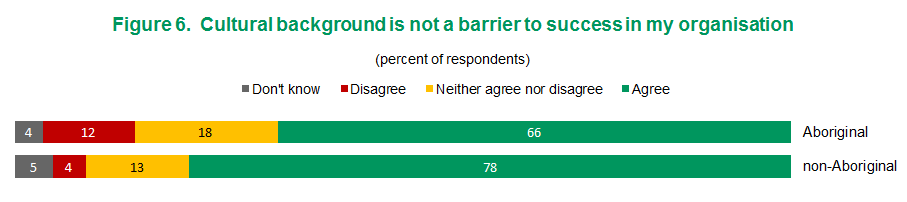
View text version of Figure 6 bar chart
View the source data as an excel spreadsheet (XLSX, 38KB)
Download Data Insights – Workplace Cultural Diversity and Inclusiveness Part 1 (PDF, 164KB)
About the People Matter SurveyThe People Matter Survey gauges Victorian public sector employee perceptions of their workplaces. The 2016 survey was conducted during May-July 2016. A total of 62,354 staff employed by 177 public sector organisations participated in the survey, achieving an overall response rate of 35 percent. |
Notes
* ↩ This article uses the term Aboriginal to refer to all Australian Aboriginal and Torres Strait Islander people. It is inclusive of all people in Victoria who identify as Indigenous Australians, Koorie and Koori.
Results for question on positive culture are based on responses from 51,070 people employed by 123 public sector organisations.
Results for question on cultural background as a barrier to success in organisation are based on responses from 57,212 people employed by 169 public sector organisations. The overall response rate for the 2016 survey was 35 percent.
Footnote [1] ↩ Researchers and human resource practitioners alike have investigated and promoted the benefits associated with a diverse workforce and the best approaches to unlock those benefits. This research include:
- Stevens, F.G (2008). Unlocking the benefits of diversity – All inclusive multiculturalism and positive organisational change.
- Aghazadeh, S. (2004). Managing workforce diversity as an essential resource for improving organisational performance.
- Pitts, D.W., and Recascino, L. (2010). Workforce diversity in the new millennium: Prospects for research.
- Hays (2014). The balancing act, creating a diverse workforce
Chart descriptors
Figure 1. Cultural background is not a barrier to success in my organisation
The majority of respondents agree with this statement.
The chart has 3 identifiers, with 4 categories of response. Numbers are expressed as a percentage of all responses, and may have been rounded up.
Born overseas in other than a Main English Speaking Country
Don’t Know 4
Disagree 7
Neither agree nor disagree 13
Agree 76
Born overseas in a Main English Speaking Country
Don’t Know 5
Disagree 6
Neither agree nor disagree 15
Agree 75
Australia-born
Don’t Know 5
Disagree 4
Neither agree nor disagree 14
Agree 77
Figure 2. There is a positive culture in my organisation for employees from varied cultural backgrounds
The majority of respondents agree with this statement.
The chart has 3 identifiers, with 4 categories of response. Numbers are expressed as a percentage of all responses, and may have been rounded up.
Born overseas in other than a Main English Speaking Country
Don’t Know 2
Disagree 5
Neither agree nor disagree 10
Agree 83
Born overseas in a Main English Speaking Country
Don’t Know 4
Disagree 5
Neither agree nor disagree 13
Agree 79
Australia-born
Don’t Know 4
Disagree 3
Neither agree nor disagree 13
Agree 81
Figure 3. My organisation fosters an environment of inclusiveness
The majority of respondents agree with this statement.
The chart has 3 identifiers, with 3 categories of response. Numbers are expressed as a percentage of all responses, and may have been rounded up.
Born overseas in other than a Main English Speaking Country
Disagree 10
Neither agree nor disagree 22
Agree 68
Born overseas in a Main English Speaking Country
Disagree 17
Neither agree nor disagree 25
Agree 59
Australia-born
Disagree 16
Neither agree nor disagree 25
Agree 59
Figure 4. My organisation fosters an environment where all staff are treated fairly and with respect
The majority of respondents agree with this statement.
The chart has 3 identifiers, with 3 categories of response. Numbers are expressed as a percentage of all responses, and may have been rounded up.
Born overseas in other than a Main English Speaking Country
Disagree 11
Neither agree nor disagree 17
Agree 72
Born overseas in a Main English Speaking Country
Disagree 19
Neither agree nor disagree 20
Agree 62
Australia-born
Disagree 18
Neither agree nor disagree 20
Agree 63
Figure 5. There is a positive culture in my organisation for employees who are aboriginal
Bar chart demonstrating that the majority of respondents agree with this statement.
The chart has 2 identifiers, Aboriginal and non-Aboriginal, with 4 categories of response. Numbers are expressed as a percentage of all responses, and may have been rounded up.
Aboriginal
Don’t Know 3
Disagree 13
Neither agree nor disagree 15
Agree 69
non-Aboriginal
Don’t Know 14
Disagree 3
Neither agree nor disagree 19
Agree 64
Figure 6. Cultural background is not a barrier to success in my organisation
Bar chart demonstrating that the majority of respondents agree with this statement.
The chart has 2 identifiers, Aboriginal and non-Aboriginal, with 4 categories of response. Numbers are expressed as a percentage of all responses, and may have been rounded up.
Aboriginal
Don’t Know 4
Disagree 12
Neither agree nor disagree 18
Agree 66
non-Aboriginal
Don’t Know 5
Disagree 4
Neither agree nor disagree 13
Agree 78