
Page 1 includes
3446 Public Sector bodies, 285692 employees, 4.1% growth from 2016, 2090 executives.
Distribution of FTE employees by industry group: 34% Public health care; 26% Government schools; 17% public service; 11% Police and emergency services; 6% Creative industries, finance, transport and other; 3% Water and land management; 3% TAFE and other education.
For additional assistance with these infographics please contact VPSC on 03 9651 1321
Page 2 includes
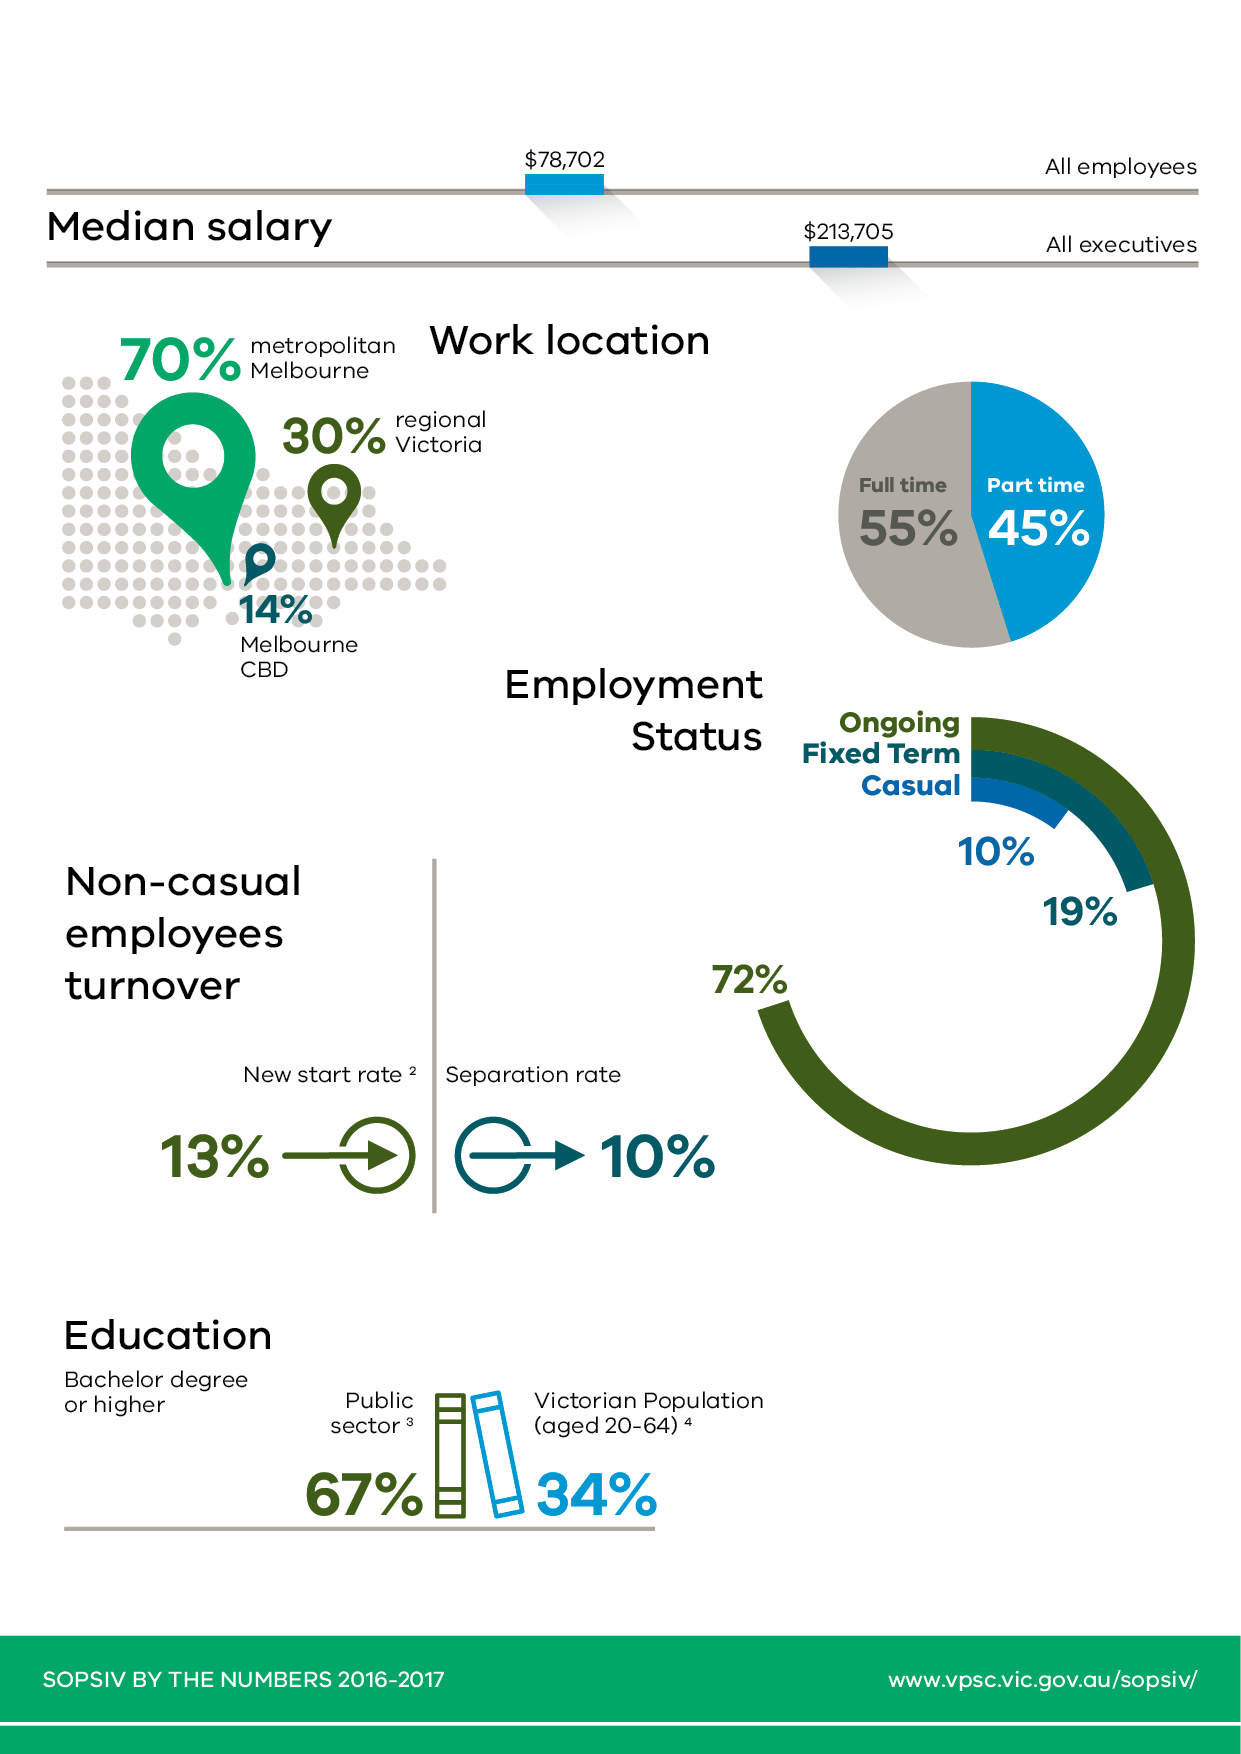
Median salary $78702; Median executive remuneration $.
Work location: 14% Melbourne CBD; 70% Metropolitan Melbourne; 30% regional Victoria.
Employment status: 55% full time; 45% part time; 72% ongoing; 19% fixed term; 10% casual.
Non casual employees turnover: 13% new start rate; 10% separation rate.
Eduction. Bachelor degree or higher: 67%
For additional assistance with these infographics please contact VPSC on 03 9651 1321
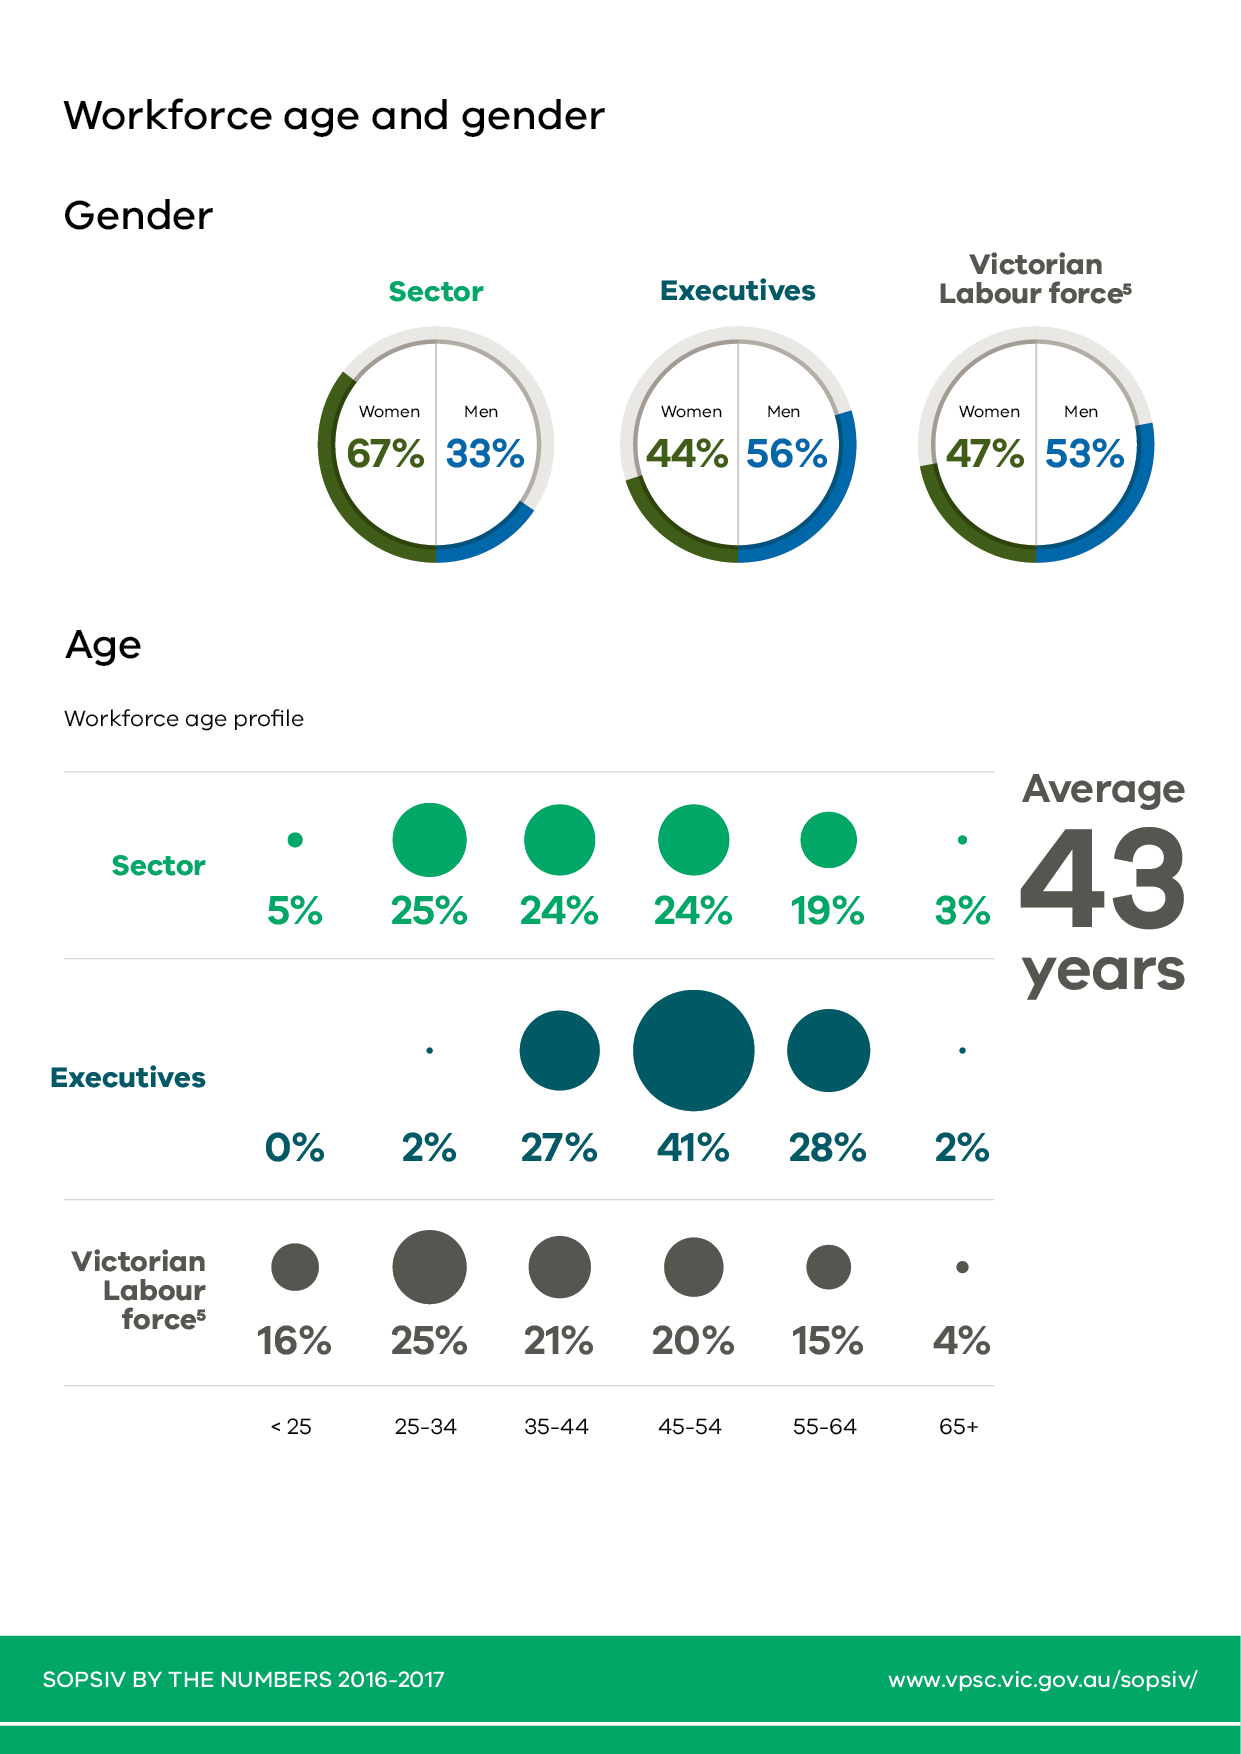
Page 3 includes the average age of employees is 43, 67% of employees are female, 44% of executives are female.
For additional assistance with these infographics please contact VPSC on 03 9651 1321
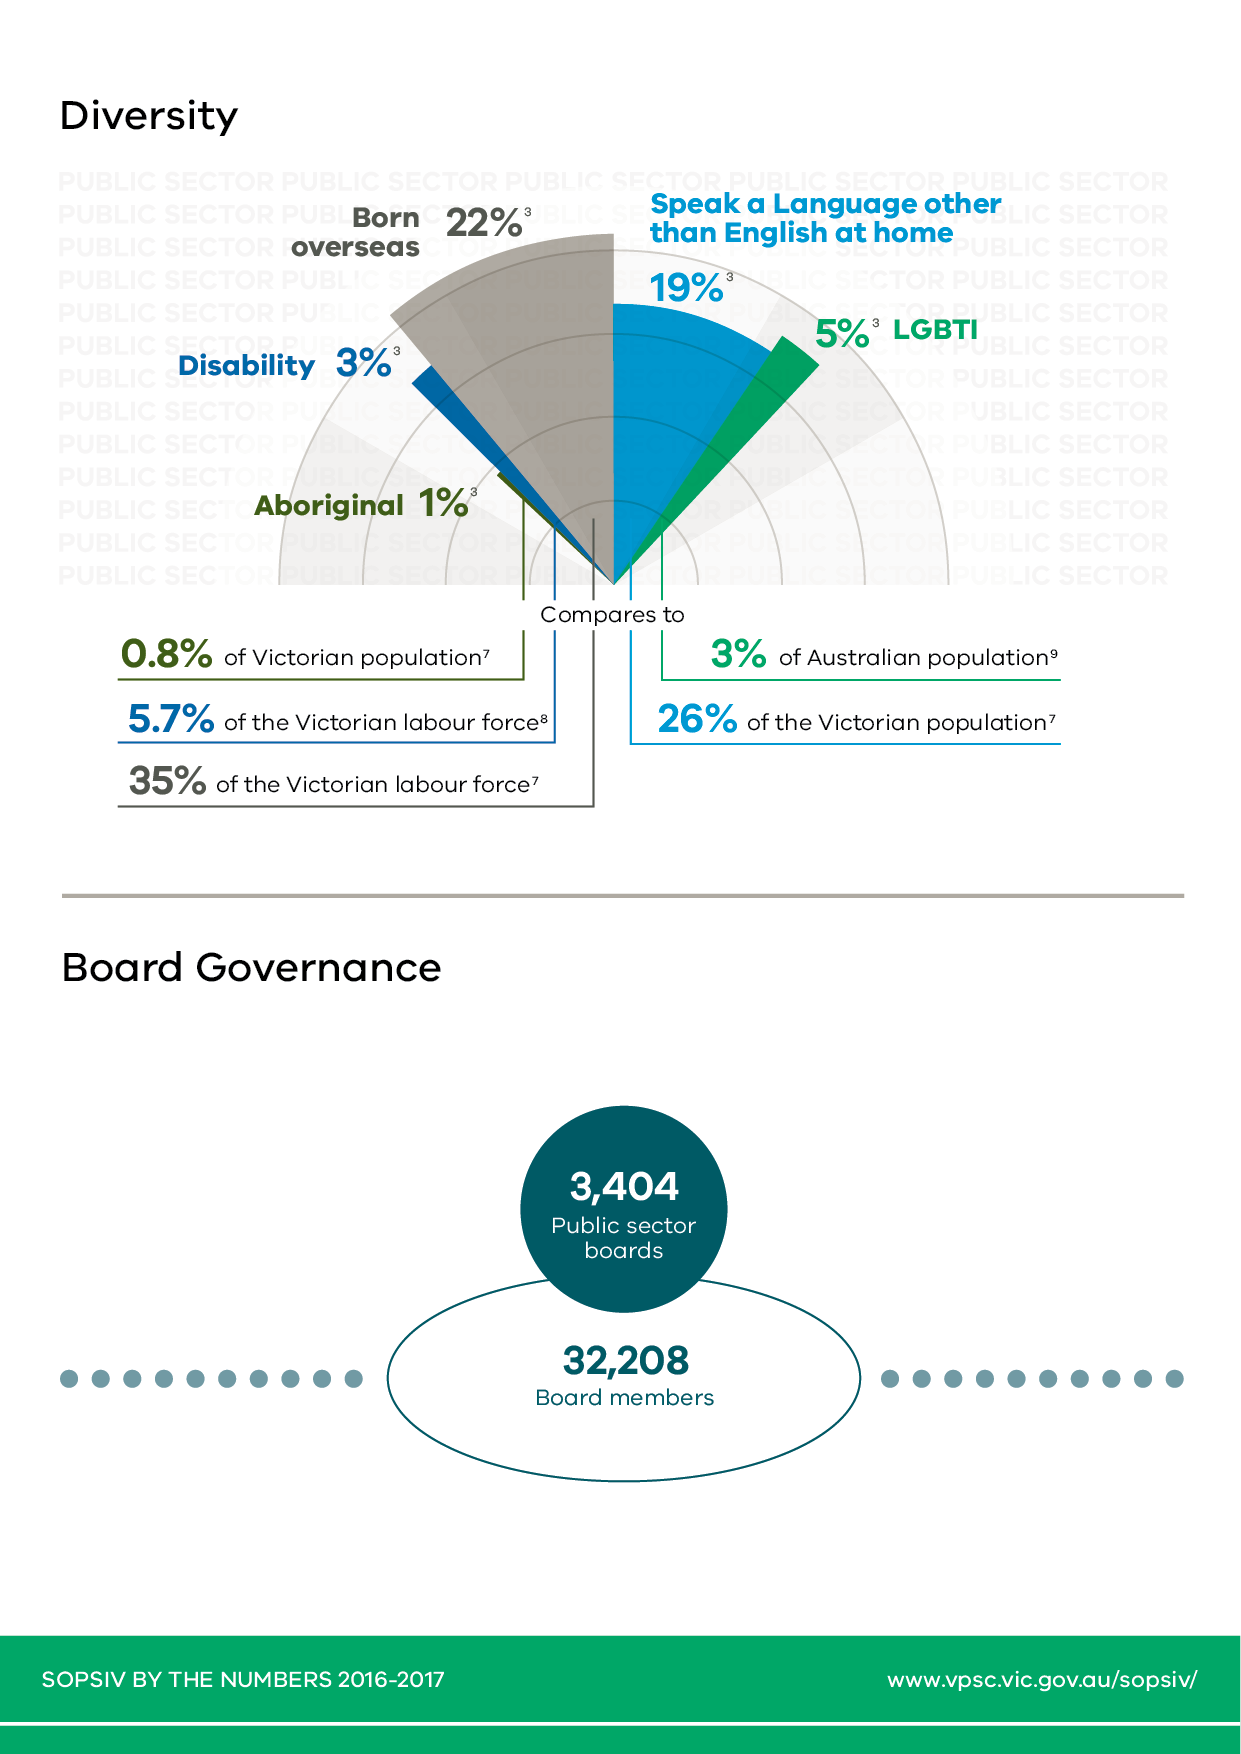
Page 4 includes: Diversity of the workforce: 1% Aboriginal; 3% of employees have a disability, 22% were born overseas, 5% LGBTI.
Number of public sector boards: 3404; with 32208 board members.
For additional assistance with these infographics please contact VPSC on 03 9651 1321
Page 5 shows statistics for public boards and contains the footnotes for the 5 pages of the infographic.
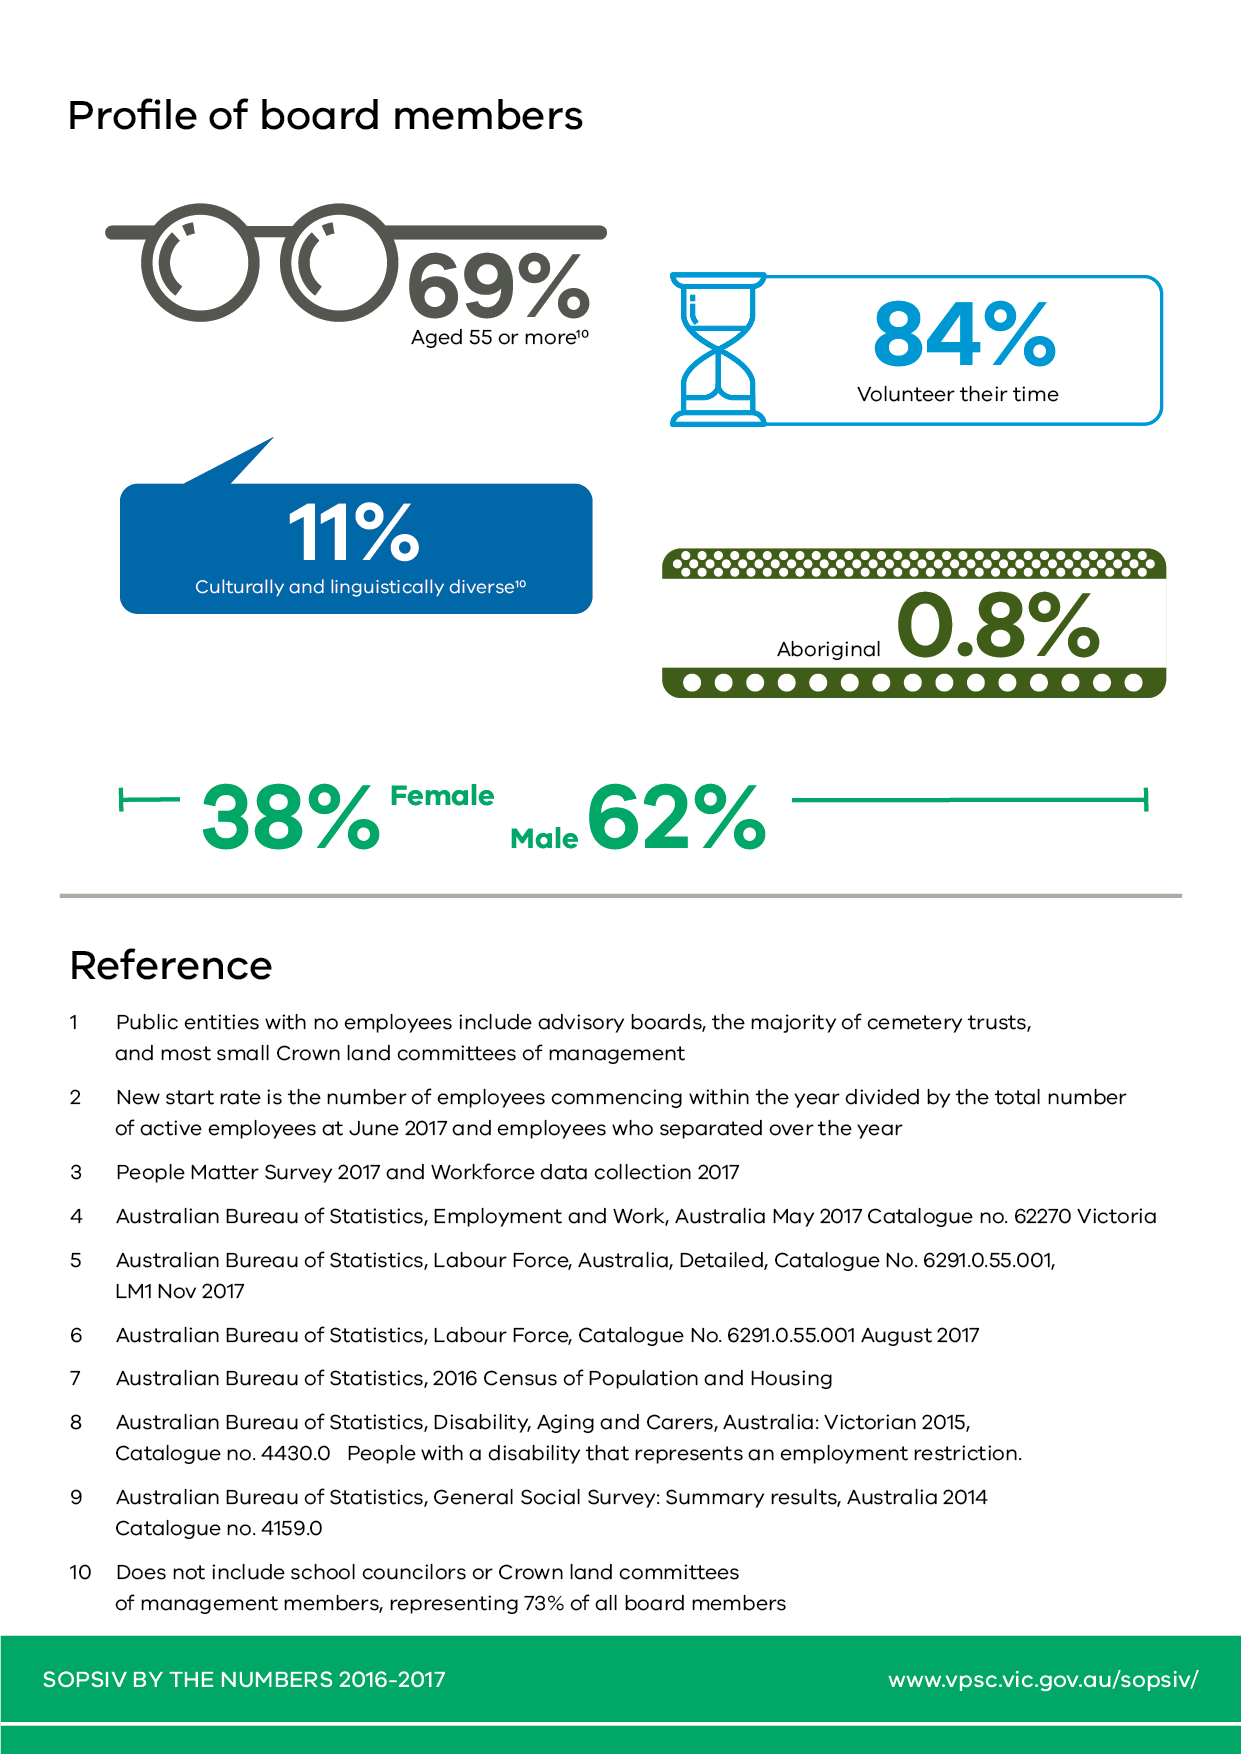
Includes profile of board members: 84% volunteer their time, 69% are aged over 55, 38% are female, 0.8% are aboriginal, 11% are culturally and linguistically diverse.
The 10 footnotes follow:
- Public entities with no employees include advisory boards, the majority of cemetery trusts, and most small Crown land committees of management
- New start rate is the number of employees commencing within the year divided by the total number of active employees at June 2017 and employees who separated over the year
- People Matter Survey 2017 and Workforce data collection 2017
- Australian Bureau of Statistics, Employment and Work, Australia May 2017 Catalogue no. 62270 Victoria
- Australian Bureau of Statistics, Labour Force, Australia, Detailed, Catalogue No. 6291.0.55.001, LM1 Nov 2017
- Australian Bureau of Statistics, Labour Force, Catalogue No. 6291.0.55.001 August 2017
- Australian Bureau of Statistics, 2016 Census of Population and Housing
- Australian Bureau of Statistics, Disability, Aging and Carers, Australia: Victorian 2015, Catalogue no. 4430.0 People with a disability that represents an employment restriction.
- Australian Bureau of Statistics, General Social Survey: Summary results, Australia 2014 Catalogue no. 4159.0
- Does not include school councilors or Crown land committees of management members, representing 73% of all board members
For additional assistance with these infographics please contact VPSC on 03 9651 1321