It is the second in a two-part series on diversity and inclusiveness, with the first pieced focused on the perceptions of employees born overseas and Aboriginal and Torres Strait Islander employees. Together, the two insights provide a profile of our sector diversity.
The benefits of a diverse workforce, which brings unique perspectives and abilities, are well documented. When looking at diversity and inclusiveness, there are a number of areas where the sector performs well. The majority of same sex attracted and bisexual employees (73 percent) feel they work in an environment where sexual orientation is not a barrier to success in their organisation. Similarly, the majority of both male and female employees (71 percent and 75 percent, respectively) feel that gender identity is not a barrier to success in their organisation.
Employees with a disability have a less positive perception on the inclusiveness of their workplaces and this remains a challenge for the sector.
Female and male employees
The 2016 People Matter Survey shows that female and male employees are equally likely to perceive their organisations as inclusive workplaces (figure 1).
They are also equally likely to perceive a positive culture for employees who use flexible work practices (figure 2), with women marginally more likely to perceive a positive culture for employees with caring responsibilities (figure 3).
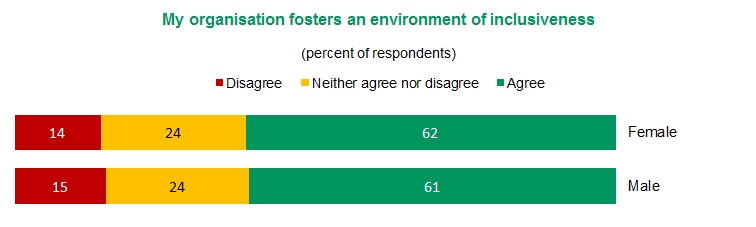
Figure 1 – My organisation fosters an environment of inclusiveness
View text version of Figure 1 bar chart
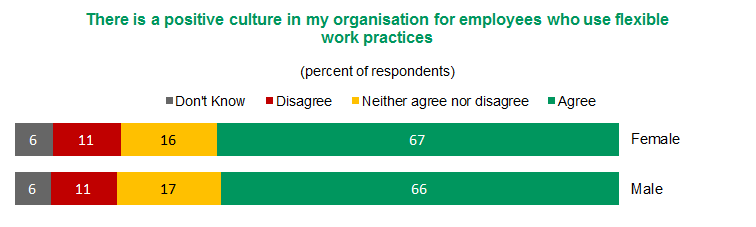
Figure 2 – There is a positive culture in my organisation for employees who use flexible work practices
View text version of Figure 2 bar chart
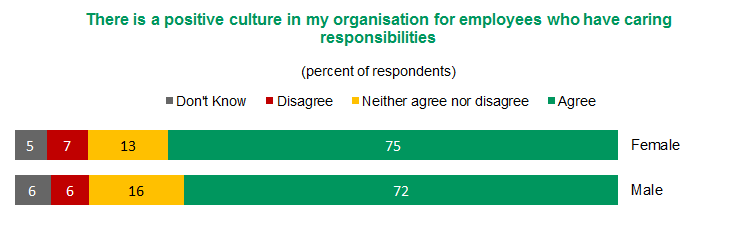
Figure 3 – There is a positive culture in my organisation for employees who have caring responsibilities
View text version of Figure 3 bar chart
Women, who comprise two thirds of the public sector workforce, are slightly more likely to report experiencing sexual harassment that men (figure 4). The Victorian Equal Opportunity and Human Rights Commission offers guidance and support to public sector organisations to fulfil their legislative obligations with respect to harassment and discrimination.
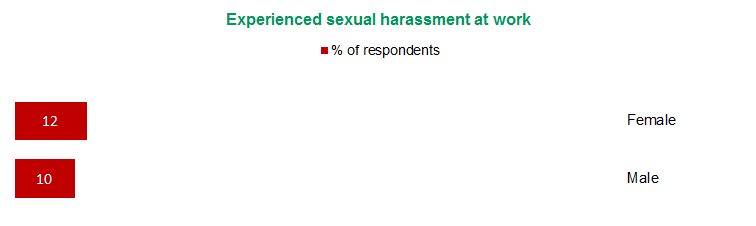
Figure 4 – Experienced sexual harassment at work
View text version of Figure 4 bar chart
Same sex attracted and bisexual employees
Most same sex attracted and bisexual employees are equally positive as heterosexual employees about workplace cultures for people who identify as lesbian, gay, bisexual, transgender or intersex. However, a small proportion have a different view, with eight percent of same sex attracted and bisexual employees perceiving a workplace culture that is not LGBTI friendly. This compares with only 2 percent of heterosexual employees having this view (see figure 5).
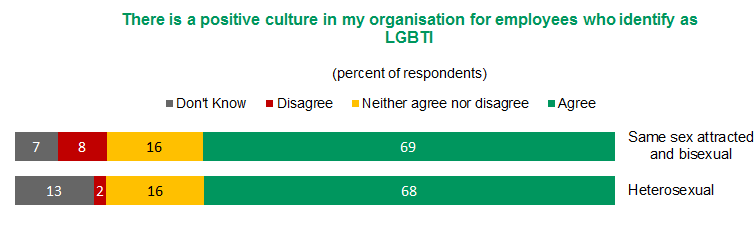
Figure 5 – There is a positive culture in my organisation for employees who identify as LGBTI
View text version of Figure 5 bar chart
Same sex attracted and bisexual employees have similar perceptions to heterosexual employees about the extent to which their workplace fosters an environment of inclusiveness (see figure 6).
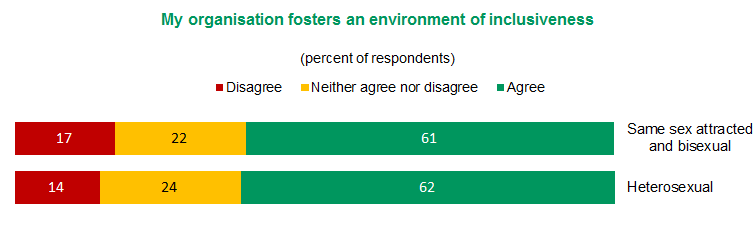
Figure 6 – My organisation fosters an environment of inclusiveness
View text version of Figure 6 bar chart
The People Matter Survey asked questions about sexual orientation and about sexual harassment for the first time in 2016.
The survey indicates that the 4.4 percent of employees who are same sex attracted or bisexual are more likely to report experiencing sexual harassment and discrimination at work (figure 7 and figure 8). The most common forms of sexual harassment reported by survey respondents are intrusive questions about their private life or comments about their physical appearance, as well as sexually suggestive comments or jokes that caused offence.
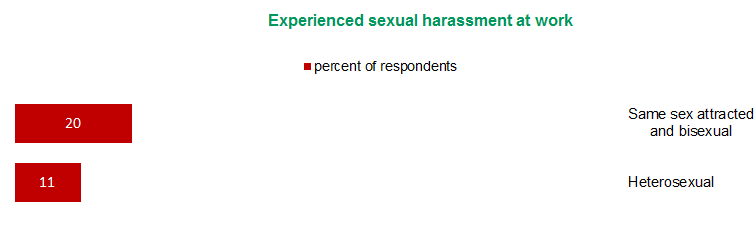
Figure 7 – Experienced sexual harassment at work
View text version of Figure 7 bar chart
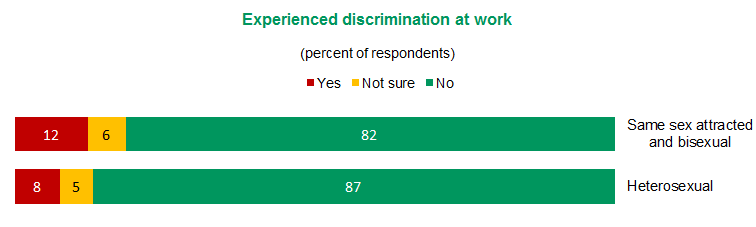
Figure 8 – Experienced discrimination at work
View text version of Figure 8 bar chart
While the People Matter Survey indicates largely positive work experiences for same sex attracted and bisexual employees, there is still the need for improvement to tackle higher rates of harassment.
Pride Networks within public sector organisations have a growing presence. In 2016, leaders and employees from across the public service marched together in the annual Midsumma Pride March.
Employees with a disability
Employees with a disability have less positive workplace perceptions than other employees. These employees comprise 3.3 percent of survey respondents. They are less likely to report a positive culture for employees with a disability (figure 9) and more likely to perceive disability as a barrier to success in the workplace (figure 10). Employees with a disability are also more likely to report experiencing discrimination at work (figure 11).
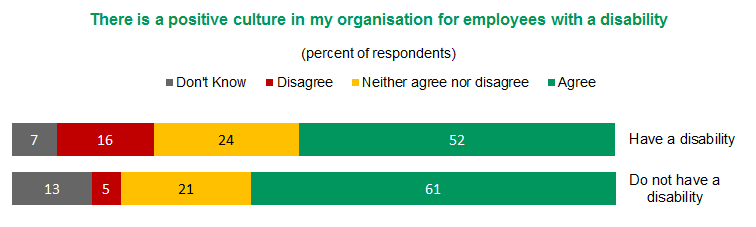
Figure 9 – There is a positive culture in my organisation for employees with a disability
View text version of Figure 9 bar chart
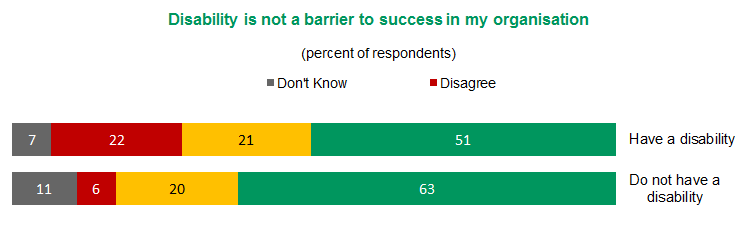
Figure 10 – Disability is not a barrier to success in my organisation
View text version of Figure 10 bar chart
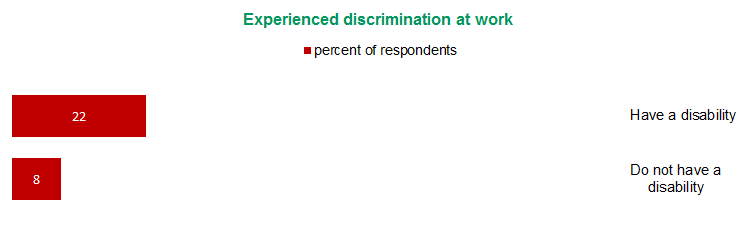
Figure 11 – Experienced discrimination at work
View text version of Figure 11 bar chart
Parts of the public sector where people with a disability were more likely to report positive work cultures include the health sector (57 percent) and water sector (56 percent).
The soon-to-be finalised Victorian State Disability plan 2017-2020 will set out shared goals to better support Victorians with a disability in all aspects of their lives.
View the source data as an excel spreadsheet (XLSX, 63KB)
Download Workplace Cultural Diversity and Inclusiveness Part 2 (PDF, 218KB)
About the People Matter SurveyThe People Matter Survey gauges Victorian public sector employee perceptions of their workplaces. The 2016 survey was conducted during May-July 2016. A total of 62,354 staff employed by 177 public sector organisations participated in the survey, achieving an overall response rate of 35 percent. |
Notes
Results for questions on positive culture and inclusiveness are based on responses from 51,070 people employed by 123 public sector organisations.
Results for the question on sexual harassment are based on responses from 46,293 people employed by 108 public sector organisations.
Results for questions on sexual orientation, gender identity and disability as a barrier to success in organisation, as well as for the question on discrimination, are based on responses from 57,212 people employed by 169 public sector organisations.
Chart descriptors
Figure 1. My organisation fosters an environment of inclusiveness.
Bar chart demonstrating the degree to which respondents agree with this statement. The response from both females and males is almost exactly the same.
The chart has 2 identifiers – Female or Male, with 3 categories of response. Numbers are expressed as a percentage of all responses, and may have been rounded up.
Female
Disagree 11
Neither agree nor disagree 24
Agree 62
Male
Disagree 15
Neither agree nor disagree 24
Agree 61
Figure 2. There is a positive culture in my organisation for employees who use flexible work practices.
Bar chart demonstrating the degree to which respondents agree with this statement. Again, the response from both females and males is almost exactly the same
The chart has 2 identifiers – Female or Male, with 4 categories of response. Numbers are expressed as a percentage of all responses, and may have been rounded up.
Female
Don’t know 6
Disagree 11
Neither agree nor disagree 16
Agree 67
Male
Don’t know 6
Disagree 11
Neither agree nor disagree 17
Agree 66
Figure 3. There is a positive culture in my organisation for employees who have caring responsibilities
Bar chart demonstrating the degree to which respondents agree with this statement.
The chart has 2 identifiers – Female or Male, with 4 categories of response. Numbers are expressed as a percentage of all responses, and may have been rounded up.
Female
Don’t know 5
Disagree 7
Neither agree nor disagree 13
Agree 75
Male
Don’t know 6
Disagree 6
Neither agree nor disagree 16
Agree 72
Figure 4. Experienced sexual harassment at work.
Bar chart demonstrating the percent of respondents who identify with this statement.
The chart has 2 identifiers – Female or Male, with 1 categories of response. Numbers are expressed as a percentage of all responses, and may have been rounded up.
Female
12
Male
10
Figure 5. There is a positive culture in my organisation for employees who identify as LGBTI
Bar chart demonstrating the degree to which respondents agree with this statement.
The chart has 2 identifiers, Same sex attracted and bisexual, and Heterosexual, with 4 categories of response. Numbers are expressed as a percentage of all responses, and may have been rounded up.
Same sex attracted and bisexual
Don’t know 7
Disagree 8
Neither agree nor disagree 16
Agree 69
Heterosexual
Don’t know 13
Disagree 2
Neither agree nor disagree 16
Agree 68
Figure 6. My organisation fosters an environment of inclusiveness.
Bar chart demonstrating the degree to which respondents agree with this statement.
The chart has 2 identifiers, Same sex attracted and bisexual, and Heterosexual, with 3 categories of response. Numbers are expressed as a percentage of all responses, and may have been rounded up.
Same sex attracted and bisexual
Disagree 17
Neither agree nor disagree 22
Agree 61
Heterosexual
Disagree 14
Neither agree nor disagree 24
Agree 62
Figure 7. Experienced sexual harassment at work
Bar chart demonstrating the percent of respondents who identify with this statement.
The chart has 2 identifiers, Same sex attracted and bisexual, and Heterosexual, with a single category of response. Numbers are expressed as a percentage of all responses, and may have been rounded up.
Same sex attracted and bisexual
20
Heterosexual
11
Figure 8. Experienced discrimination at work.
Bar chart demonstrating the degree to which respondents agree with this statement.
The chart has 2 identifiers, Same sex attracted and bisexual, and Heterosexual, with 3 categories of response, Yes, Not sure and No. Numbers are expressed as a percentage of all responses, and may have been rounded up.
Same sex attracted and bisexual
Yes 12
Not sure 6
No 82
Do not have a disability
Yes 8
Not sure 5
No 87
Figure 9. There is a positive culture in my organisation for employees with a disability.
Bar chart demonstrating the degree to which respondents agree with this statement.
The chart has 2 identifiers, Have a disability and Do not have a disability, with 4 categories of response. Numbers are expressed as a percentage of all responses, and may have been rounded up.
Have a disability
Don’t know 7
Disagree 16
Neither agree nor disagree 24
Agree 52
Do not have a disability
Don’t know 13
Disagree 5
Neither agree nor disagree 21
Agree 61
Figure 10. Disability is not a barrier to success in my organisation.
Bar chart demonstrating the degree to which respondents agree with this statement.
The chart has 2 identifiers, Have a disability and Do not have a disability, with 4 categories of response. Numbers are expressed as a percentage of all responses, and may have been rounded up.
Have a disability
Don’t know 7
Disagree 22
Neither agree nor disagree 21
Agree 51
Do not have a disability
Don’t know 11
Disagree 6
Neither agree nor disagree 20
Agree 63
Figure 11. Experienced discrimination at work.
Bar chart demonstrating the percent of respondents who identify with this statement.
The chart has 2 identifiers, Have a disability and Do not have a disability, with a single category of response. Numbers are expressed as a percentage of all responses, and may have been rounded up.
Have a disability
22
Do not have a disability
8